Cases

Scaling Dutch transitions with shared metrics and data
Case summary
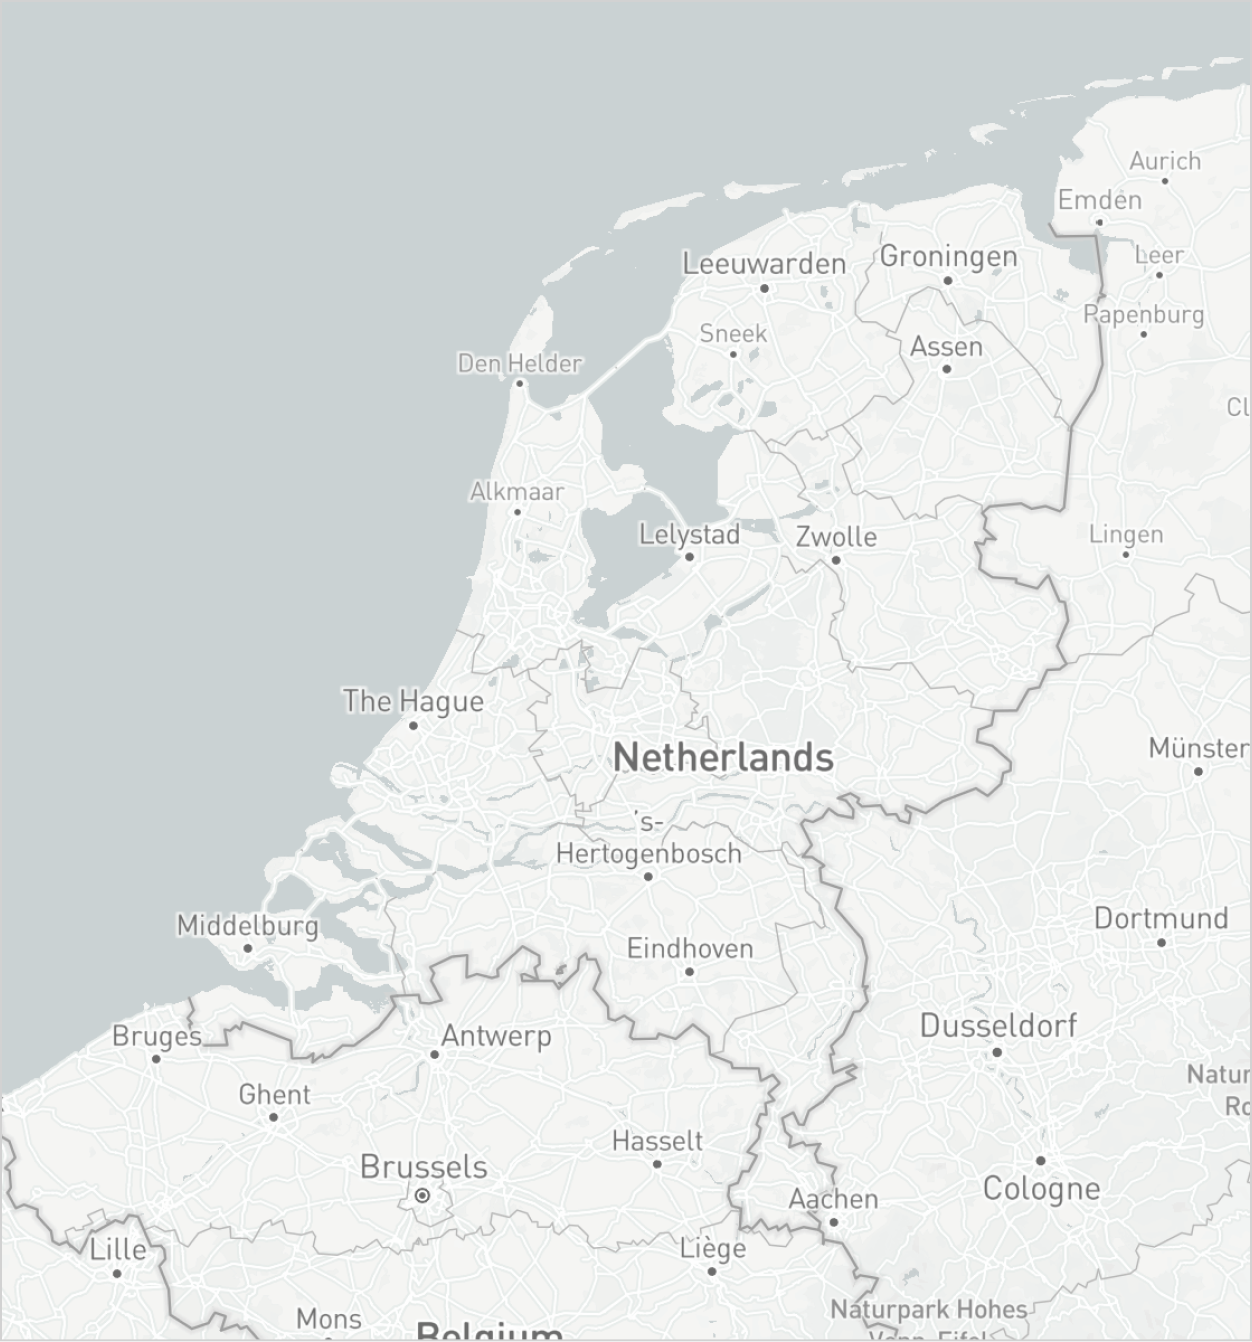
Energy, mobility, housing, and climate data from ten Dutch municipalities are connected into one shared playbook promoted by the Dutch government.
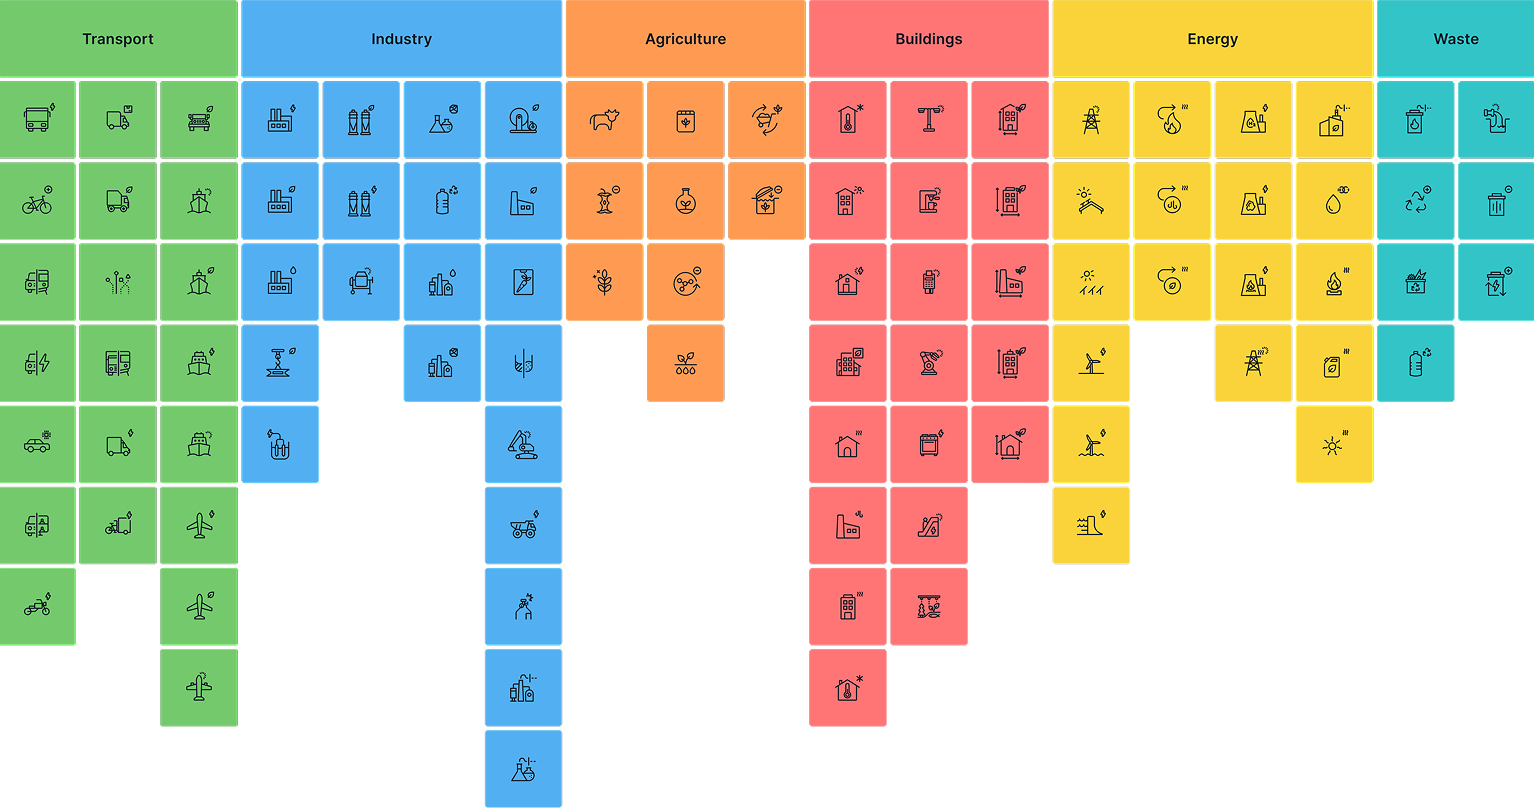
ClimateView’s Transition Elements uses science to structure the data and suggest metrics that can be compared across cities and over time.
Politicians, policymakers and the public can gather around dashboards that everyone understands.

"For the cities, one important learning was that it is possible to use the platform for political decision-making. We see they are already taking it to their Aldermen."
Roy Boertien,
Smart Cities Advisor, Ministry of Infrastructure
and Water Management in the Netherlands
Reliable, comparable data for smarter decision-making
Climate action is taken locally. Departments on the municipal level will analyze research and suggest initiatives to eliminate carbon dioxide emissions. In the case of the Netherlands, it meant energy, mobility, housing, sustainability, and climate plans were being created independently with no clear link to a joint climate ambition or access to comparable data. This fragmented information and lack of standardized methodology led to inconsistent results and unreliable comparisons.
"Some of the calculations had variations of more than 20%," says Serge van den Berg, co-founder of sustainability consultancy firm HetEnergieBureau. In some cases, numbers showed flawed ratios of CO₂e emissions per capita when examining cities side by side.
To address this, the Dutch Metropolitan Innovations (DMI) ecosystem partnered with ClimateView to launch a pilot project and pioneer a data-driven approach to urban transition planning. A cooperation between governments on all levels, the DMI aims to deliver new digital tools for mobility, housing and energy.
Dutch municipalities have access to a science-based and technology-driven methodology that provides a shared and scalable structure with comparable data designed to align energy, mobility, housing, sustainability, and climate policies across cities, nationally and over time.
With the project’s initial phase, the cities of Emmen, Groningen, Haarlem and Rotterdam can track the impact of interventions holistically, refine strategies in real time and share them easily.
The project introduces a nationwide data playbook by laying a foundation for broader adoption, including integration with Climate City Contracts (CCC), Sustainable Urban Mobility Plans (SUMPs), and Regional Mobility Plans (RMPs).
The information is publicly available and can be accessed anytime through individual dashboards built according to ClimateView’s Transition Elements, an open-source and widely adopted model for systemic urban decarbonization.
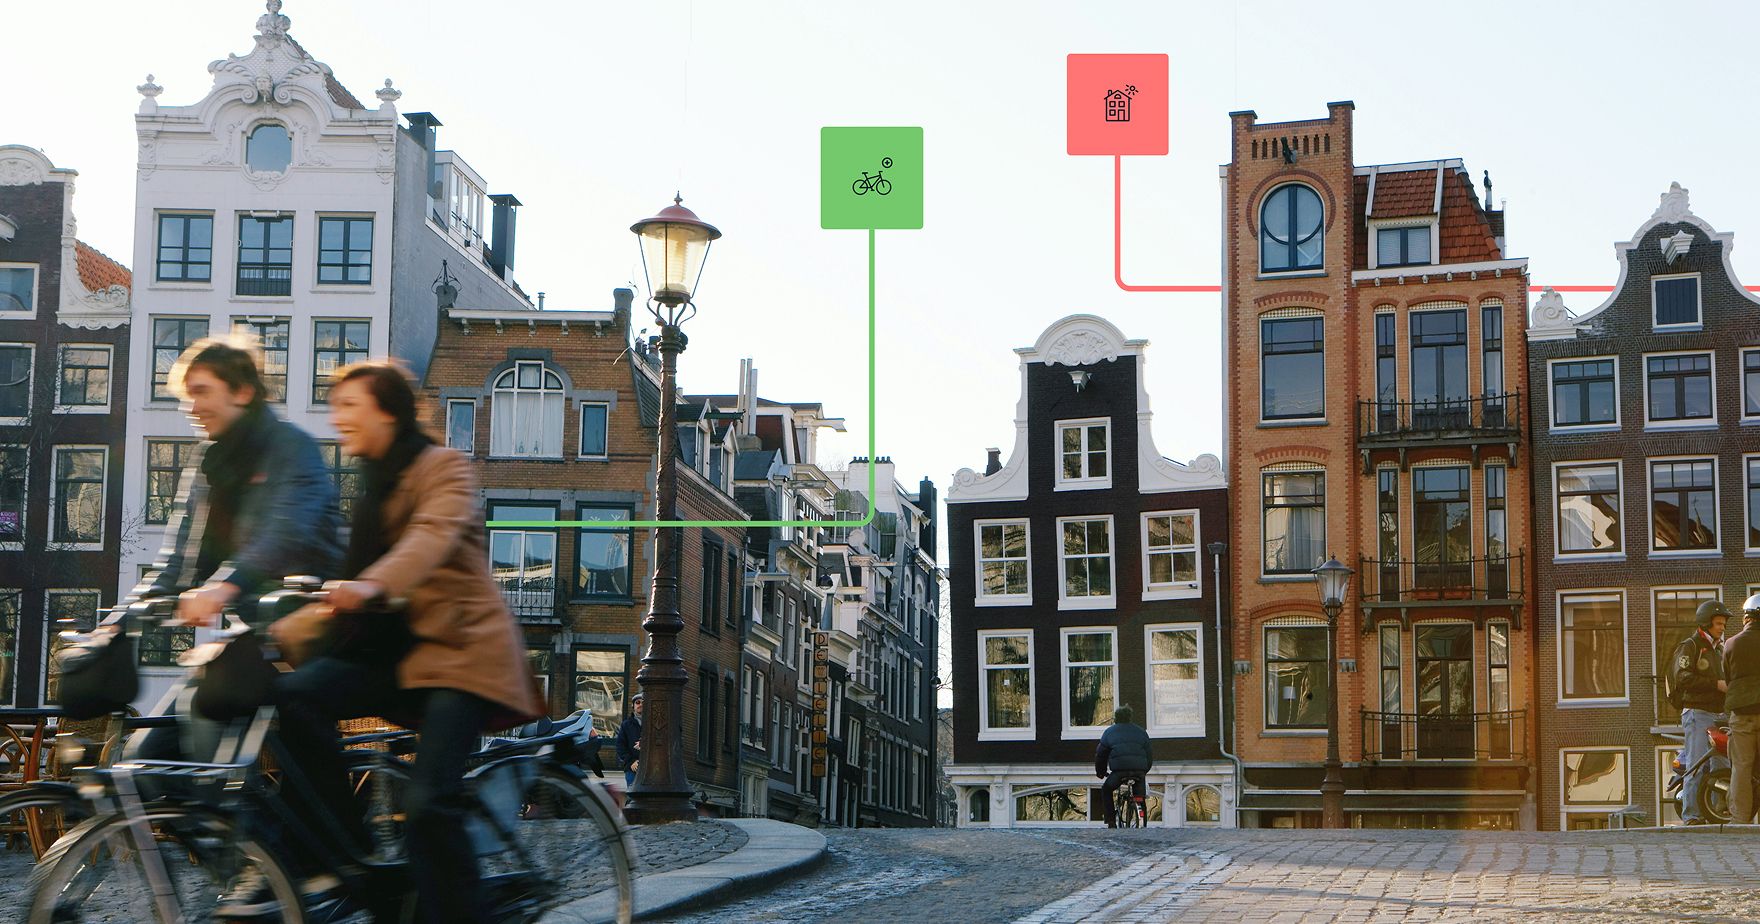

"The ClimateView platform has value beyond progress tracking. It goes into the interventions and their combined effects. When you do one thing toward cycling, for instance, you see how it affects public transport."
Roy Boertien,
Smart Cities Advisor, Ministry of Infrastructure
and Water Management in the Netherlands
A goldmine when used wisely
By working with Transition Elements, cities were able to make connections between each local department's development plans with policy plans and climate ambition, attaching granular emissions data to each activity or measure.
"In the end, we need to convince people to take action — that’s the point. The specialists know what to do. It’s far more important to convince politicians, inhabitants and policymakers to look at the future in a more realistic way," says Jan-Kees Kleuver, Groningen’s Coordinator for the EU Mission 100 Climate Neutral and Smart Cities 2030.
According to Kleuver, how the data is presented can spark a needed emotional response from people, something he attributes to the "attractiveness of the dashboard". "It’s much more relatable for people not deeply involved in climate change. The way they can recognize the model is very important for the acceptance," he explains.
The dashboard is also key in providing clarity around investments and how many euros must be spent to achieve these goals.
"In the case of Haarlem, we could clearly see the impact of subsidy on personal EVs had on decreased emissions each year," explains Boertien. The framework is particularly relevant in bringing clarity to cities’ plans and defining what actions should be prioritized. "Emmen’s dashboard illustrated how many people should shift from private car use each year to reach climate goals. We saw that was really not feasible," he explains.
The potential of having one unified data playbook goes beyond country borders. Both Roy Boertien and Serge van den Berg see the benefits of drawing comparisons and learnings across the globe. "We can have a discussion about why Glasgow, for example, is so successful in implementing a specific action. It is a goldmine of data, and you can use it wisely," says van den Berg.
He refers to ClimateView’s ability to pinpoint what type of action should be taken and in what volume each year, with a precision that goes down to the individual shift — the number of people, vehicles, buildings, heat pumps, or solar panels, for example.
The project in numbers
32,596
houses are addressed by ongoing and planned energy efficiency shifts in Rotterdam.
1,600
On average, 1,600 people need to shift from fossil cars to electric vehicles each year in Haarlem.
72%
EVs would achieve 72% of share in Haarlem by 2030 with linear growth.

"There is comfort in knowing the exact number. If we have a goal and action, we can calculate how successful we were in 2023, 2024, and so on. The monitoring tool is next level."
Serge van den Berg,
Co-founder of HetEnergieBureau
Transition technology for areas worldwide
Cities are able to work with the dashboard themselves and have the possibility of including additional data and resources that are relevant to them. "This is something that we also wanted to address from the DMI side since public-private partnerships have an important role in our ecosystem," says Roy Boertien.